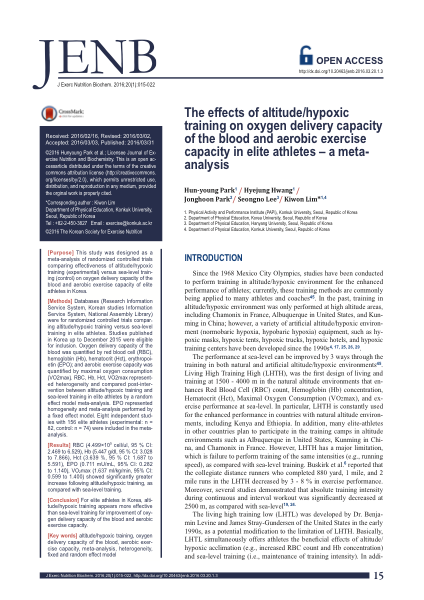
Abstract
dition, 60 that were not relevant determinants or out - J Exerc Nutrition Biochem. 2016;20(1):015-022, http://dx.doi.org/10.20463/jenb.2016.03.20.1.3 16 Figure 1. PRISMA chart of the search and study inclusion process
J Exerc Nutrition Biochem. 2016;20(1):015-022, http://dx.doi.org/10.20463/jenb.2016.03.20.1.3 17The effects of altitude/hypoxic training in elite athletes – a meta-analysis Journal of Exercise Nutrition & Biochemistry come data for enhanced athletic performance were exclud- ed. Thus, 25 retrieved selected full texts were reviewed so that the excluded were as follows: not elite athletes (e.g. healthy humans, the elderly, and patients), no control group, not relevant dependent variables on oxygen deliv - ery capacity of the blood and aerobic exercise capacity, and no data used in the meta-analyses (e.g., mean, standard deviation, and sample size). Therefore, based on study characteristics of 161 references initially identified, 8 were included in the aggregate meta-analysis. Characteristics and variables of selected references The 8 selected references were classified according to authors, published year, characteristics of subjects, number of subjects, and altitude/hypoxic environments training (e.g., type, duration, and frequency) (Table 1) and the number of subjects were 156 subjects (exercise group: 82 and control group: 74). All studies were conducted on elite athletes: 1 of high school soccer players, 2 of high school track players, 1 of national level fin swimmers, 1 of colle - giate tennis players, 1 of national level swimmers, 1 of col- legiate track players, and 1 of collegiate basketball players. Additionally, types of altitude/hypoxic environments train - ing consisted of 2 LHTH, 1 LHTL, and 5 LLTH. Of these 8 studies, meta-analyses included 8 oxygen delivery capacity of the blood (e.g., RBC, Hb, and Hct), 5 EPO, and 7 aerobic exercise capacity, in order to determine the comprehensive efficacy of oxygen delivery capacity of the blood and aerobic exercise capacity in altitude/hypoxic environments training for the enhanced athletic perfor - mance. Statistical analysis All statistical analyses were performed with Excel (Mi- crosoft, USA) and CMA version 3.0 (Biostat, USA). We used Cohen’s d where the term effect size can refer to the value of a statistic calculated from a sample of data and standardized mean differences 8 . However, a lower Cohen’s d indicates the necessity of Hedges’g due to a bias of the overestimated effect size, vice versa, as can subsequently be converted
CMA version 3.0 (Biostat, USA). We used Cohen’s d where the term effect size can refer to the value of a statistic calculated from a sample of data and standardized mean differences 8 . However, a lower Cohen’s d indicates the necessity of Hedges’g due to a bias of the overestimated effect size, vice versa, as can subsequently be converted to g with the larger sample size and lower sample size 20 . This meta-analysis calculated the effect size of studies that converted from Cohen’s d to Hedges’g with correction factor. A Q-statistic and Higgins’ I 2 statistic were employed to provide a test of statistical homogeneity for the differences in effect sizes among studies. Under the fixed-effect model we calculated the weighted effect size (weighted mean dif - ference: WMD) if the test of homogeneity was statistically significant, and vice versa, we allowed the random effect model if the test of heterogeneity was significant. A significance level of a < 0.05 was used to determine statistical difference for mean of effect size and the confi - dence interval was reflected at a confidence level of 95 %. RESULTS The effect of altitude/hypoxic training on oxygen delivery capacity of the blood Eight studies were selected for the effect of altitude/hy- poxic training on RBC, Hb, Hct and 5 studies for the effect of altitude/hypoxic training on EPO. Among oxygen deliv - Table 1. Characteristics of included studies for meta-analysis Kim et al. (2009) Exp. (18) males Soccer players - LLTH(IHE) : 3,000m simulated altitude resting and sleeping - 8hrs, 7days/week, 4weeks Exp. (10) - LHTH: living and training in 1,896m altitude 60~70%HRmax Jung et al. (2004) males Athletes exercise, 7.5hrs, 6days/week, 4weeks Con. (10) - resting and sleeping at the remaining non-exercise time Male - LLTH(IHT): 3,000m simulated altitude Sunoo et al. (2007) Exp. (11) and Fin swimmers - 80%HRmax exercise intensity Con. (10) female - 30min treadmill exercise and 30min bike exercise - 1hrs, 4days/week, 3weeks - LLTH(IHT): 2,500m~4,000m simulated altitude increased Yun & Lee (2014) Exp. (8) Male Tennis players by 500m in every week Con. (8) -
remaining non-exercise time Male - LLTH(IHT): 3,000m simulated altitude Sunoo et al. (2007) Exp. (11) and Fin swimmers - 80%HRmax exercise intensity Con. (10) female - 30min treadmill exercise and 30min bike exercise - 1hrs, 4days/week, 3weeks - LLTH(IHT): 2,500m~4,000m simulated altitude increased Yun & Lee (2014) Exp. (8) Male Tennis players by 500m in every week Con. (8) - resting, aerobic and anaerobic exercise - 6hrs, 3days/week, 4weeks Exp. (8) - LLTH(IHT): 2,500m simulated altitude Shin & Cho (2003) Male Swimmers - aerobic exercise Con. (8) - 1hrs, 5days/week, 4weeks Exp. (8) Female - LHTH: 3,000m simulated altitude living(8hrs), 2,000m simulated Sunoo & Hwang (2004) Female (5) Athletes altitude training(1.5hrs) Con. (7) Male (2) - 70%VO2max training, 4days/week, 6weeks Exp. (10) - LHTL: Living(3,000m), Training(700~1,330m) Park et al. (2011) Male Athletes more than16 hrs residence everyday(living) Con. (10) - aerobic and interval exercise(training), 4hrs, 6day/week, 4weeks Sunoo et al. (2005) Exp. (9) males Basketball players - LLTH(IHE): 3,000m simulated altitude resting and sleeping Con. (9) - 8hrs, 7days/week, 3weeks Study N Sex Subject Altitude/Hypoxic training type
J Exerc Nutrition Biochem. 2016;20(1):015-022, http://dx.doi.org/10.20463/jenb.2016.03.20.1.3 The effects of altitude/hypoxic training in elite athletes – a meta-analysis Journal of Exercise Nutrition & Biochemistry ery capacity of the blood, heterogeneity was identified in RBC (Q-value = 106.578, p = .000, I 2 = 93.432) and effect size calculated by random effect model. Elite athletes in the altitude/hypoxic training group improved their RBC by 4.499×10 5 cell/μl (95 % CI: 2.469 - 6.529, p = .000) more than the sea-level training group (Table 2). Heterogeneity was also identified in Hb (Q-value = 119.043, p = .000, I 2 = 94.120) and effect size calculated by random effect model. Elite athletes in the altitude/hypoxic training group improved their Hb by 5.447 g/dl (95% CI: 3.028 - 7.866, p = .000) more than the sea-level training group (Table 3). Likewise, heterogeneity was identified in Hct, (Q-value = 104.973, p = .000, I 2 = 93.332) and effect size calculated by random effect model. Elite athletes in the altitude/hy - poxic training group improved their Hct by 3.639 % (95% CI: 1.687 - 5.591, p = .000) more than the sea-level train - ing group (Table 4). However, in EPO, homogeneity was identified (Q-value = 2.115, p = .715, I 2 = .000) and effect size calculated by fixed effect model. Elite athletes in the altitude/hypoxic training group improved their EPO by 18 Sunoo et al. (2007) 1.453 0.491 0.241 0.490 2.415 2.958 0.003 Shin and Cho (2003) 31.752 5.635 31.756 20.707 42.797 5.635 0.000 Yun and Lee (2014) 2.832 0.708 0.501 1.445 4.219 4.003 0.000 Park et al. (2011) 7.062 1.203 1.447 4.705 9.420 5.871 0.000 Sunoo and Hwang (2004) 0.761 0.536 0.287 -0.289 1.811 1.420 0.156 Sunoo et al. (2005) 2.292 0.607 0.368 1.103 3.482 3.778 0.000 Jung et al. (2004) 0.632 0.458 0.210 -0.266 1.531 1.380 0.168 Kim et al. (2009) 15.891 2.085 4.348 11.804 19.978 7.621 0.000 Random 4.499 1.036 1.073 2.469 6.529 4.343 0.000 Table 2. Effects of altitude/hypoxic training vs. sea-level training on RBC (10 5 cell/μl). Model Study name Std diff standard variance Lower Upper Z-value p-value in
1.103 3.482 3.778 0.000 Jung et al. (2004) 0.632 0.458 0.210 -0.266 1.531 1.380 0.168 Kim et al. (2009) 15.891 2.085 4.348 11.804 19.978 7.621 0.000 Random 4.499 1.036 1.073 2.469 6.529 4.343 0.000 Table 2. Effects of altitude/hypoxic training vs. sea-level training on RBC (10 5 cell/μl). Model Study name Std diff standard variance Lower Upper Z-value p-value in means error limit limit Heterogeneity: Q-value=106.572(p=.000), I 2 =93.432 Sunoo et al. (2007) 1.453 0.491 0.241 0.490 2.415 2.958 0.003 Shin and Cho (2003) 96.449 17.057 290.953 63.018 129.881 5.654 0.000 Yun and Lee (2014) 2.825 0.707 0.499 1.440 4.210 3.998 0.000 Park et al. (2011) 19.037 3.043 9.260 13.073 25.002 6.256 0.000 Sunoo and Hwang (2004) 0.790 0.537 0.289 -0.263 1.843 1.470 0.142 Sunoo et al. (2005) 3.771 0.786 0.617 2.231 5.311 4.800 0.000 Jung et al. (2004) 1.511 0.507 0.257 0.518 2.505 2.981 0.003 Kim et al. (2009) 15.064 1.980 3.921 11.183 18.945 7.608 0.000 Random 5.447 1.234 1.523 3.028 7.866 4.414 0.000 Table 3. Effects of altitude/hypoxic training vs. sea-level training on Hb (g/dl). Model Study name Std diff standard variance Lower Upper Z-value p-value in means error limit limit Heterogeneity: Q-value=119.043(p=.000), I 2 =94.120 Heterogeneity: Q-value=104.973(p=.000), I 2 =93.332 Sunoo et al. (2007) 4.834 0.864 0.747 3.140 6.528 5.592 0.000 Shin and Cho (2003) 7.217 1.370 1.878 4.531 9.903 5.267 0.000 Yun and Lee (2014) 3.726 0.827 0.684 2.105 5.347 4.506 0.000 Park et al. (2011) 2.285 0.575 0.331 1.158 3.412 3.974 0.000 Sunoo and Hwang (2004) 0.222 0.519 0.270 -0.795 1.240 0.428 0.669 Sunoo et al. (2005) 1.102 0.506 0.256 0.111 2.094 2.178 0.029 Jung et al. (2004) 0.899 0.469 0.220 -0.021 1.819 1.916 0.055 Kim et al. (2009) 56.258 7.272 52.888 42.004 70.511 7.736 0.000 Random 3.639 0.996 0.992 1.687 5.591 3.654 0.000 Table 4. Effects of altitude/hypoxic training vs. sea-level training on Hct (%). Model Study name Std diff standard variance Lower Upper Z-value p-value in means error limit limit
0.000 Random 3.639 0.996 0.992 1.687 5.591 3.654 0.000 Table 4. Effects of altitude/hypoxic training vs. sea-level training on Hct (%). Model Study name Std diff standard variance Lower Upper Z-value p-value in means error limit limit
Description
Meta-analysis shows altitude training improves blood oxygen delivery and aerobic capacity in elite athletes.